Onionprobe standalone monitoring node
Onionprobe comes with full monitoring environment based on the Compose Specification, and with:
- An Onionprobe container instance continuously monitoring endpoints.
- Metrics are exported to a Prometheus instance.
- Alerts are managed using Alertmanager.
- A Grafana Dashboard is available for browsing the metrics and using a PostgreSQL service container as the database backend.
The monitoring node can run with any tool implementing the Compose Specification, such as Docker Compose or Podman Compose.
Tip
The Standalone monitoring node can be easily configured with Ansible through the Onionprobe Role.
Requirements
The standalone node have the following resource requirements:
- A machine with at least 2GB of RAM.
- At least 2GB disk space for the container images.
- At least 500MB disk space for the container volumes (but that really depends on the number of onionsites you monitor, and for how long you want to keep this data).
Configuring the monitoring node
By default, the monitoring node periodically compiles the Onionprobe configuration
from the official Tor Project Onion Services into contrib/tpo.yaml, by using
the tpo.py script.
This and other configurations can be changed by creating an .env file in the
toplevel project folder.
Check the sample .env for an example.
Choosing the container runtime
The monitoring node can run with either Docker (with Docker Compose) or Podman (with Podman Compose).
Refer to upstream documentation on how to do the basic setup for each of these runtimes.
The container runtime is configured at the .env file, with the
CONTAINER_RUNTIME variable.
Info
The default container runtime is Docker.
The Onionprobe Monitor script
The monitoring node can be operated directly using Docker Compose or
Podman Compose, but a convenience script named onionprobe-monitor is
offered as a thin wrapper to the container runtime implementation.
Starting the monitoring node
The monitoring node may be started using the onionprobe-monitor script:
./onionprobe-monitor up   # This will fork into the background after bootstrap
./onionprobe-monitor logs # View container logs
The monitoring node sets up storage volumes, which means that the monitoring dataset collected is persistent across service container reboots.
Accessing the monitoring dashboards and the exporter
Once the dashboards are started, point your browser to the following addresses if you're running locally:
- The built-in Prometheus dashboard: http://localhost:9090
- The built-in Alertmanager dashboard: http://localhost:9093
- The built-in Grafana dashboard: http://localhost:3000
- The built-in Onionprobe Prometheus exporter: http://localhost:9935
These services are also automatically exported as Onion Services, which addresses can be discovered by running the following command when the services are running:
./onionprobe-monitor hostnames
You can also get this info from the host by browsing directly the
onionprobe_tor volume.
It's also possible to replace the automatically generated Onion Service addresses by using keys with vanity addresses using a tool like Onionmine.
Protecting the monitoring dashboards and the exporter
By default, all dashboards and the are accessible without credentials.
You can protect them by setting up Client Authorization:
- Run
./onionprobe-monitor genkeys. This script accepts an optional username argument (defaulting toadmin):./onionspray-monitor genkeys myuser. - Restart the
torservice container from the host to ensure that this new configuration is applied:./onionprobe-monitor restart tor
Copying existing client authorization keys, in case you generated the keys in another machine:
- Setup your client credentials according to the docs.
- Place the
.authfiles at the Onion Servicesauthorized_clientsfolder of thetorcontainer:- Prometheus:
/var/lib/tor/prometheus/authorized_clients. - Alertmanager:
/var/lib/tor/alertmanager/authorized_clients. - Grafana:
/var/lib/tor/grafana/authorized_clients. - Onionprobe:
/var/lib/tor/onionprobe/authorized_clients.
- Prometheus:
- Restart the
torservice container from the host to ensure that this new configuration is applied:./onionprobe-monitor restart tor
In either case, the private keys for each service can be displayed using
./onionprobe-monitor showkeys
By default, keys are shown for the admin user.
To get keys for a specific user, specify it in the command line, like:
./onionprobe-monitor showkeys myuser
Credentials may be removed:
    ./onionprobe-monitor removekeys myuser
    ./onionprobe-monitor restart tor
Note
The Grafana dashboard also comes with it's own user management
system, whose default user and password is admin. You might change this
default user and not setup the Client Authorization for Grafana, or maybe
use both depending or your security needs.
Managing the monitoring node with systemd
The monitoring node can be managed with systemd. A sample service file is provided and can be adapted.
Using the monitoring node
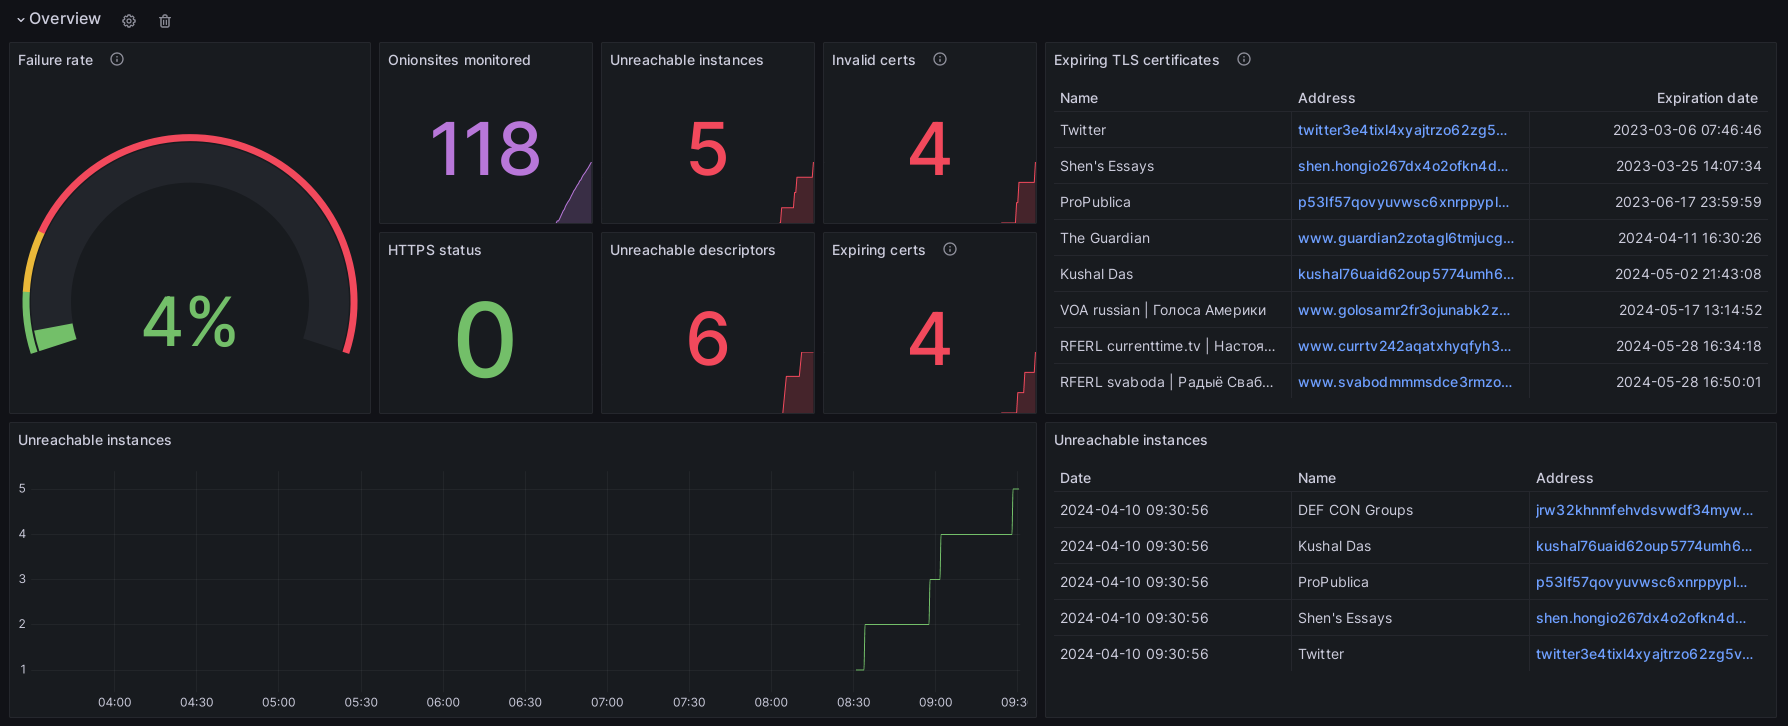
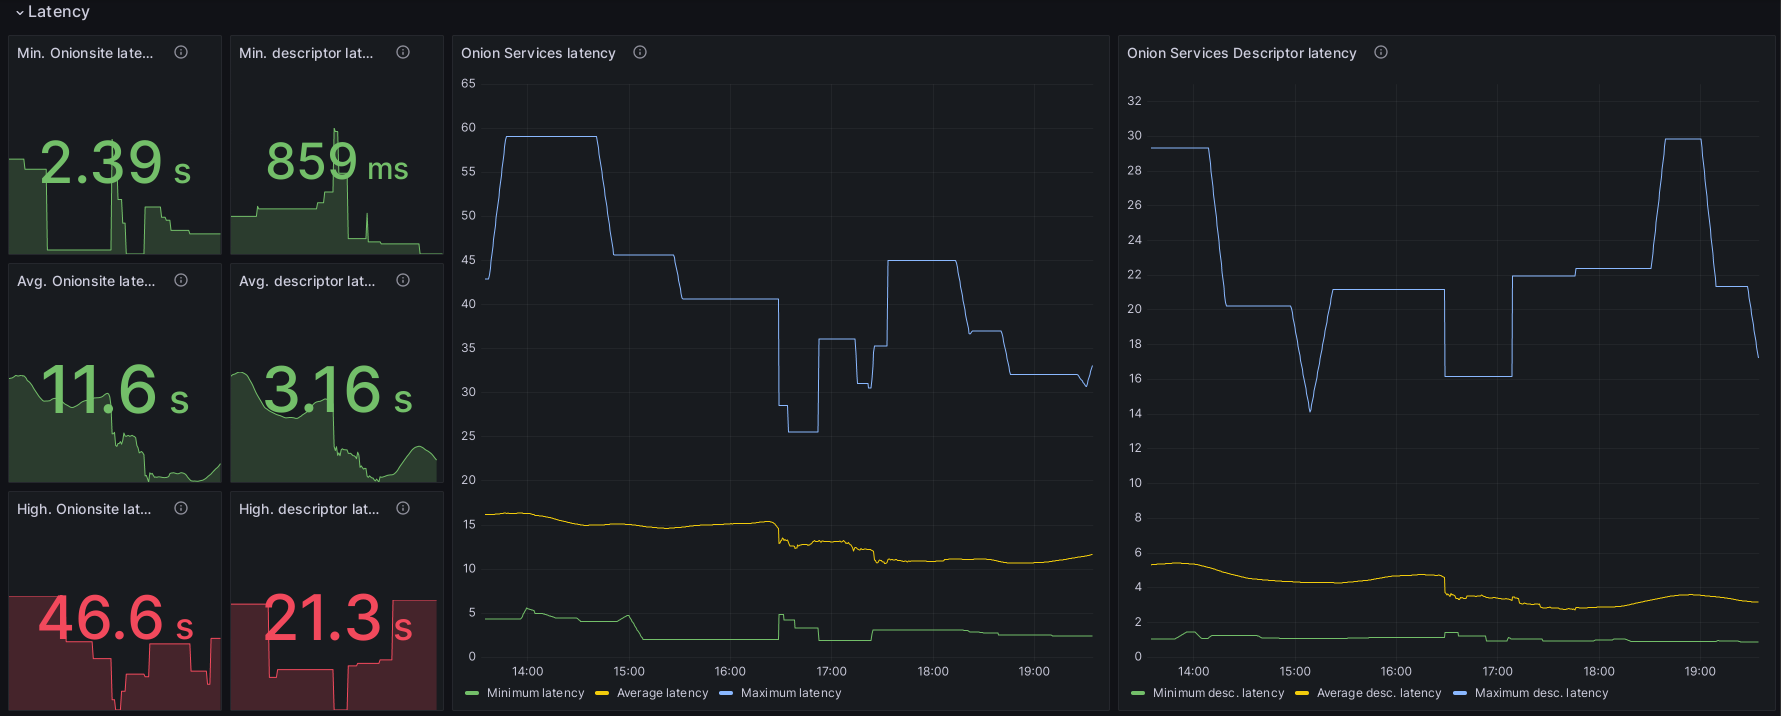
Once your monitoring node is up and running, you can create your dashboards an visualizations as usual, getting the data compiled by Onionprobe using Prometheus as the data source.
Grafana already comes with a basic default dashboard as it's homepage.
Overview:

Onion Service latency:

Onion Service descriptors:

Introduction Points:

Enabling Tor's Prometheus metrics exporter
For debugging and research purposes, Onionprobe support Tor's MetricsPort and
MetricsPortPolicy configuration parameters, along with a Prometheus,
Alertmanager and Grafana integrations.
These Tor parameters are available on Onionprobe as metrics_port and
metrics_port_policy configuration or command line parameters.
WARNING: Before enabling this, it is important to understand that exposing
tor metrics publicly is dangerous to the Tor network users. Please take extra
precaution and care when opening this port. Set a very strict access policy
with MetricsPortPolicy and consider using your operating systems firewall
features for defense in depth.
We recommend, for the prometheus format, that the only address that can access this port should be the Prometheus server itself. Remember that the connection is unencrypted (HTTP) hence consider using a tool like stunnel to secure the link from this port to the server.
These settings are disabled by default. To enable it in the monitoring node, follow the steps below.
1. Onionprobe configuration
At the Onionprobe config you're using (like configs/tor.yaml), set
metrics_port and metrics_port_policy to some sane values.
The most basic, non-recommended example:
# The following should work by default for containers in the
# 172.16.0.0/12 subnet.
metrics_port: '0.0.0.0:9936'
metrics_port_policy: 'accept 172.16.0.0/12'
Another basic, non-recommended example:
# The following should work by default for a local network, including local
# containers (not recommended):
metrics_port: '0.0.0.0:9936'
metrics_port_policy: 'accept 192.168.0.0/16,accept 10.0.0.0/8,accept 172.16.0.0/12'
A safer, more restricted and recommended example:
# This will allow only the host 172.19.0.100 to connect, and requires
# that the Prometheus service containers binds to this IP address.
metrics_port: '172.19.0.100:9936'
metrics_port_policy: 'accept 172.19.0.100'
2. Docker Compose configuration
It's recommended metrics_port_policy to be the most restricted as possible,
bound to a single IP address.
To do that, edit docker-compose.yaml and ensure that the prometheus container have
a fixed IP like the 172.19.0.100 from the example above. This can be done by
uncommenting the following lines:
services:
  prometheus:
    [...]
    # Use a static network IP to allow Prometheus to collect MetricsPort data
    # from onionprobe's Tor process.
    networks:
      default:
        ipv4_address: 172.19.0.100

  [...]

  # Use a static network range to allow Prometheus to collect MetricsPort data
  # from onionprobe's Tor process.
  networks:
    onionprobe:
      ipam:
        config:
          - subnet: 172.19.0.0/24
3. Applying the configuration
Once you have set the configuration, stop and then restart all containers for the configuration to take effect.
The metrics should then be automatically available on Prometheus, Alertmanager and Grafana.
Check the MetricsPort documentation for more information.